Quickstart
This walks through one match end to end: load it, summarize it, plot it. Five minutes, no data of your own required – the package ships a real (anonymized) match export for exactly this.
Load a match
load_matches() reads a match export and returns a
tidy events pandas.DataFrame – one row per event, one column
per qualifierId, named q_<id>, plus a matchId column. It’s the
one loading function for every provider and either one file or a whole
folder (a season). Every call takes the same two keywords – provider
("opta" default, "statsbomb" or "impect") and type
("match" default for a single file, "season" for a folder) –
so nothing else about the call changes shape between them:
from wa_setpieces import load_matches

events = load_matches("tests/data/sample_match.json", provider="opta", type="match")
events.head()

# A folder, or a different provider, work exactly the same way:
load_matches("season/", provider="statsbomb", type="season")
load_matches("impect_export.csv", provider="impect", type="match")
Need the raw matchDetails block (kickoff time, venue, scores) rather
than just the events? load_events() reads a single
Opta JSON file and returns a Match
with both: match.match_details and match.events. See
Installation’s “Input data” section for the full provider picture.
Summarize every set piece
set_piece_summary() is the one-call headline table:
attempts, success rate, shots and goals, per team, for all six set-piece
types at once.
from wa_setpieces import set_piece_summary

set_piece_summary(events)
            contestantId set_piece_type  attempts  successful  success_rate  shots  goals
cxb4hqite921i...      corner         2           1         0.500      0      0
cxb4hqite921i...   free_kick        12           9         0.750      0      0
cxb4hqite921i...   goal_kick         8           5         0.625      0      0
cxb4hqite921i...    kick_off         1           1         1.000      0      0
cxb4hqite921i...    throw_in        20          16         0.800      0      0
f2yd0yzt0om6q...      corner         7           1         0.143      0      0
f2yd0yzt0om6q...   free_kick        13           9         0.692      0      0
f2yd0yzt0om6q...   goal_kick         4           3         0.750      0      0
f2yd0yzt0om6q...    kick_off         3           3         1.000      0      0
f2yd0yzt0om6q...    throw_in        30          27         0.900      0      0
Plot the deliveries
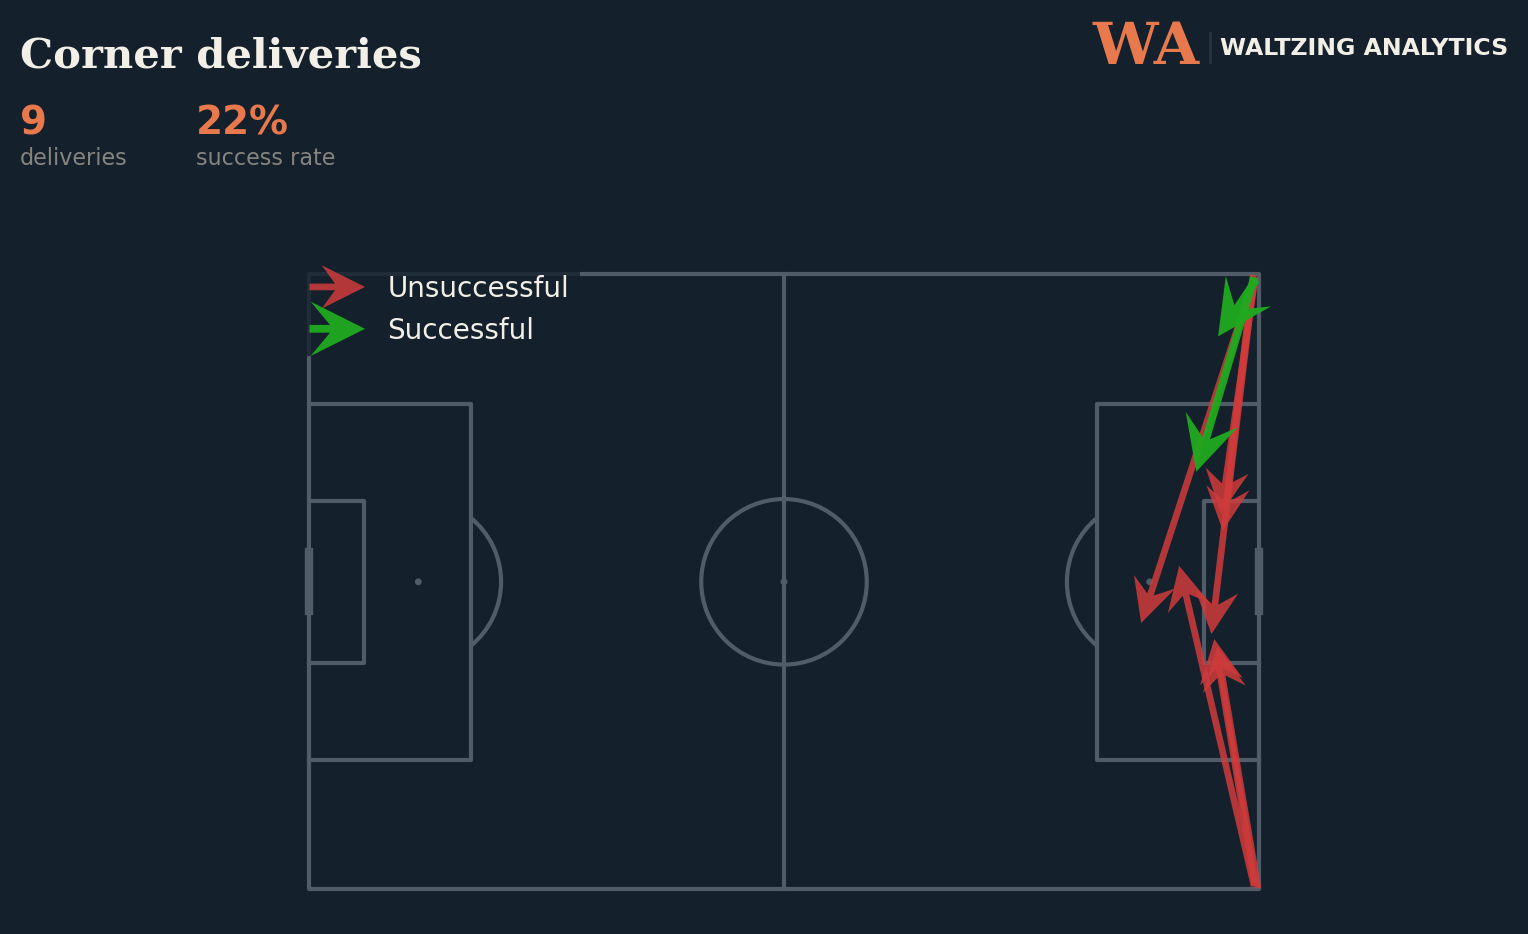
delivery_locations() pulls out start/end pitch
coordinates for one set-piece type; plot_delivery_map()
(needs the viz extra) draws it on an mplsoccer pitch.
from wa_setpieces import delivery_locations
from wa_setpieces.viz.plots import plot_delivery_map

corners = delivery_locations(events, "corner")
fig, ax = plot_delivery_map(corners, title="Corner deliveries")
Run the whole pipeline
Everything past a summary table – second-phase detection, retention,
an xT-based added-value score, a 0-100 rating, routine taxonomy,
defensive conceding, aerial duels – is one more call:
run_workflow() runs the full chain for one
set-piece type and hands back every table in a single
SetPieceWorkflow.
from wa_setpieces import run_workflow, XTModel

model = XTModel.fit(events)  # optional -- unlocks added value + player rating
result = run_workflow(events, "corner", model=model)

result.report          # everything above, rolled up per team
result.team_rating      # 0-100 benchmark score per team
result.player_rating    # delivery score / finishing score per player
Note
Fitting XTModel on one match, as above, is
illustrative only – it’s nowhere near enough data for a trustworthy
grid. Fit across a season instead; see By value model.
The same thing from the command line:
wa-setpieces workflow tests/data/sample_match.json --type corner --output tables/ --format xlsx
Where next
By set piece – already know which set piece you care about? Corner, free kick, throw-in, penalty, goal kick or kick-off: see exactly what’s available for it.
By value model – already know which value model you care about? xT, added value, shot value, team/player/defensive rating: see what each one measures and how to compute it.
By metric, By phase and outcome, By routine, By report and export – the same pick-one-see-how-it-works reference for metrics/zones, phases/outcomes, routines, and reporting/export.
Gallery – every plot this package makes, with the source code that made it.